This project started in 2021/22 making Instagram graphics out of statistics.
Have a statistics that you would like transformed into an infographic? Connect & collaborate.
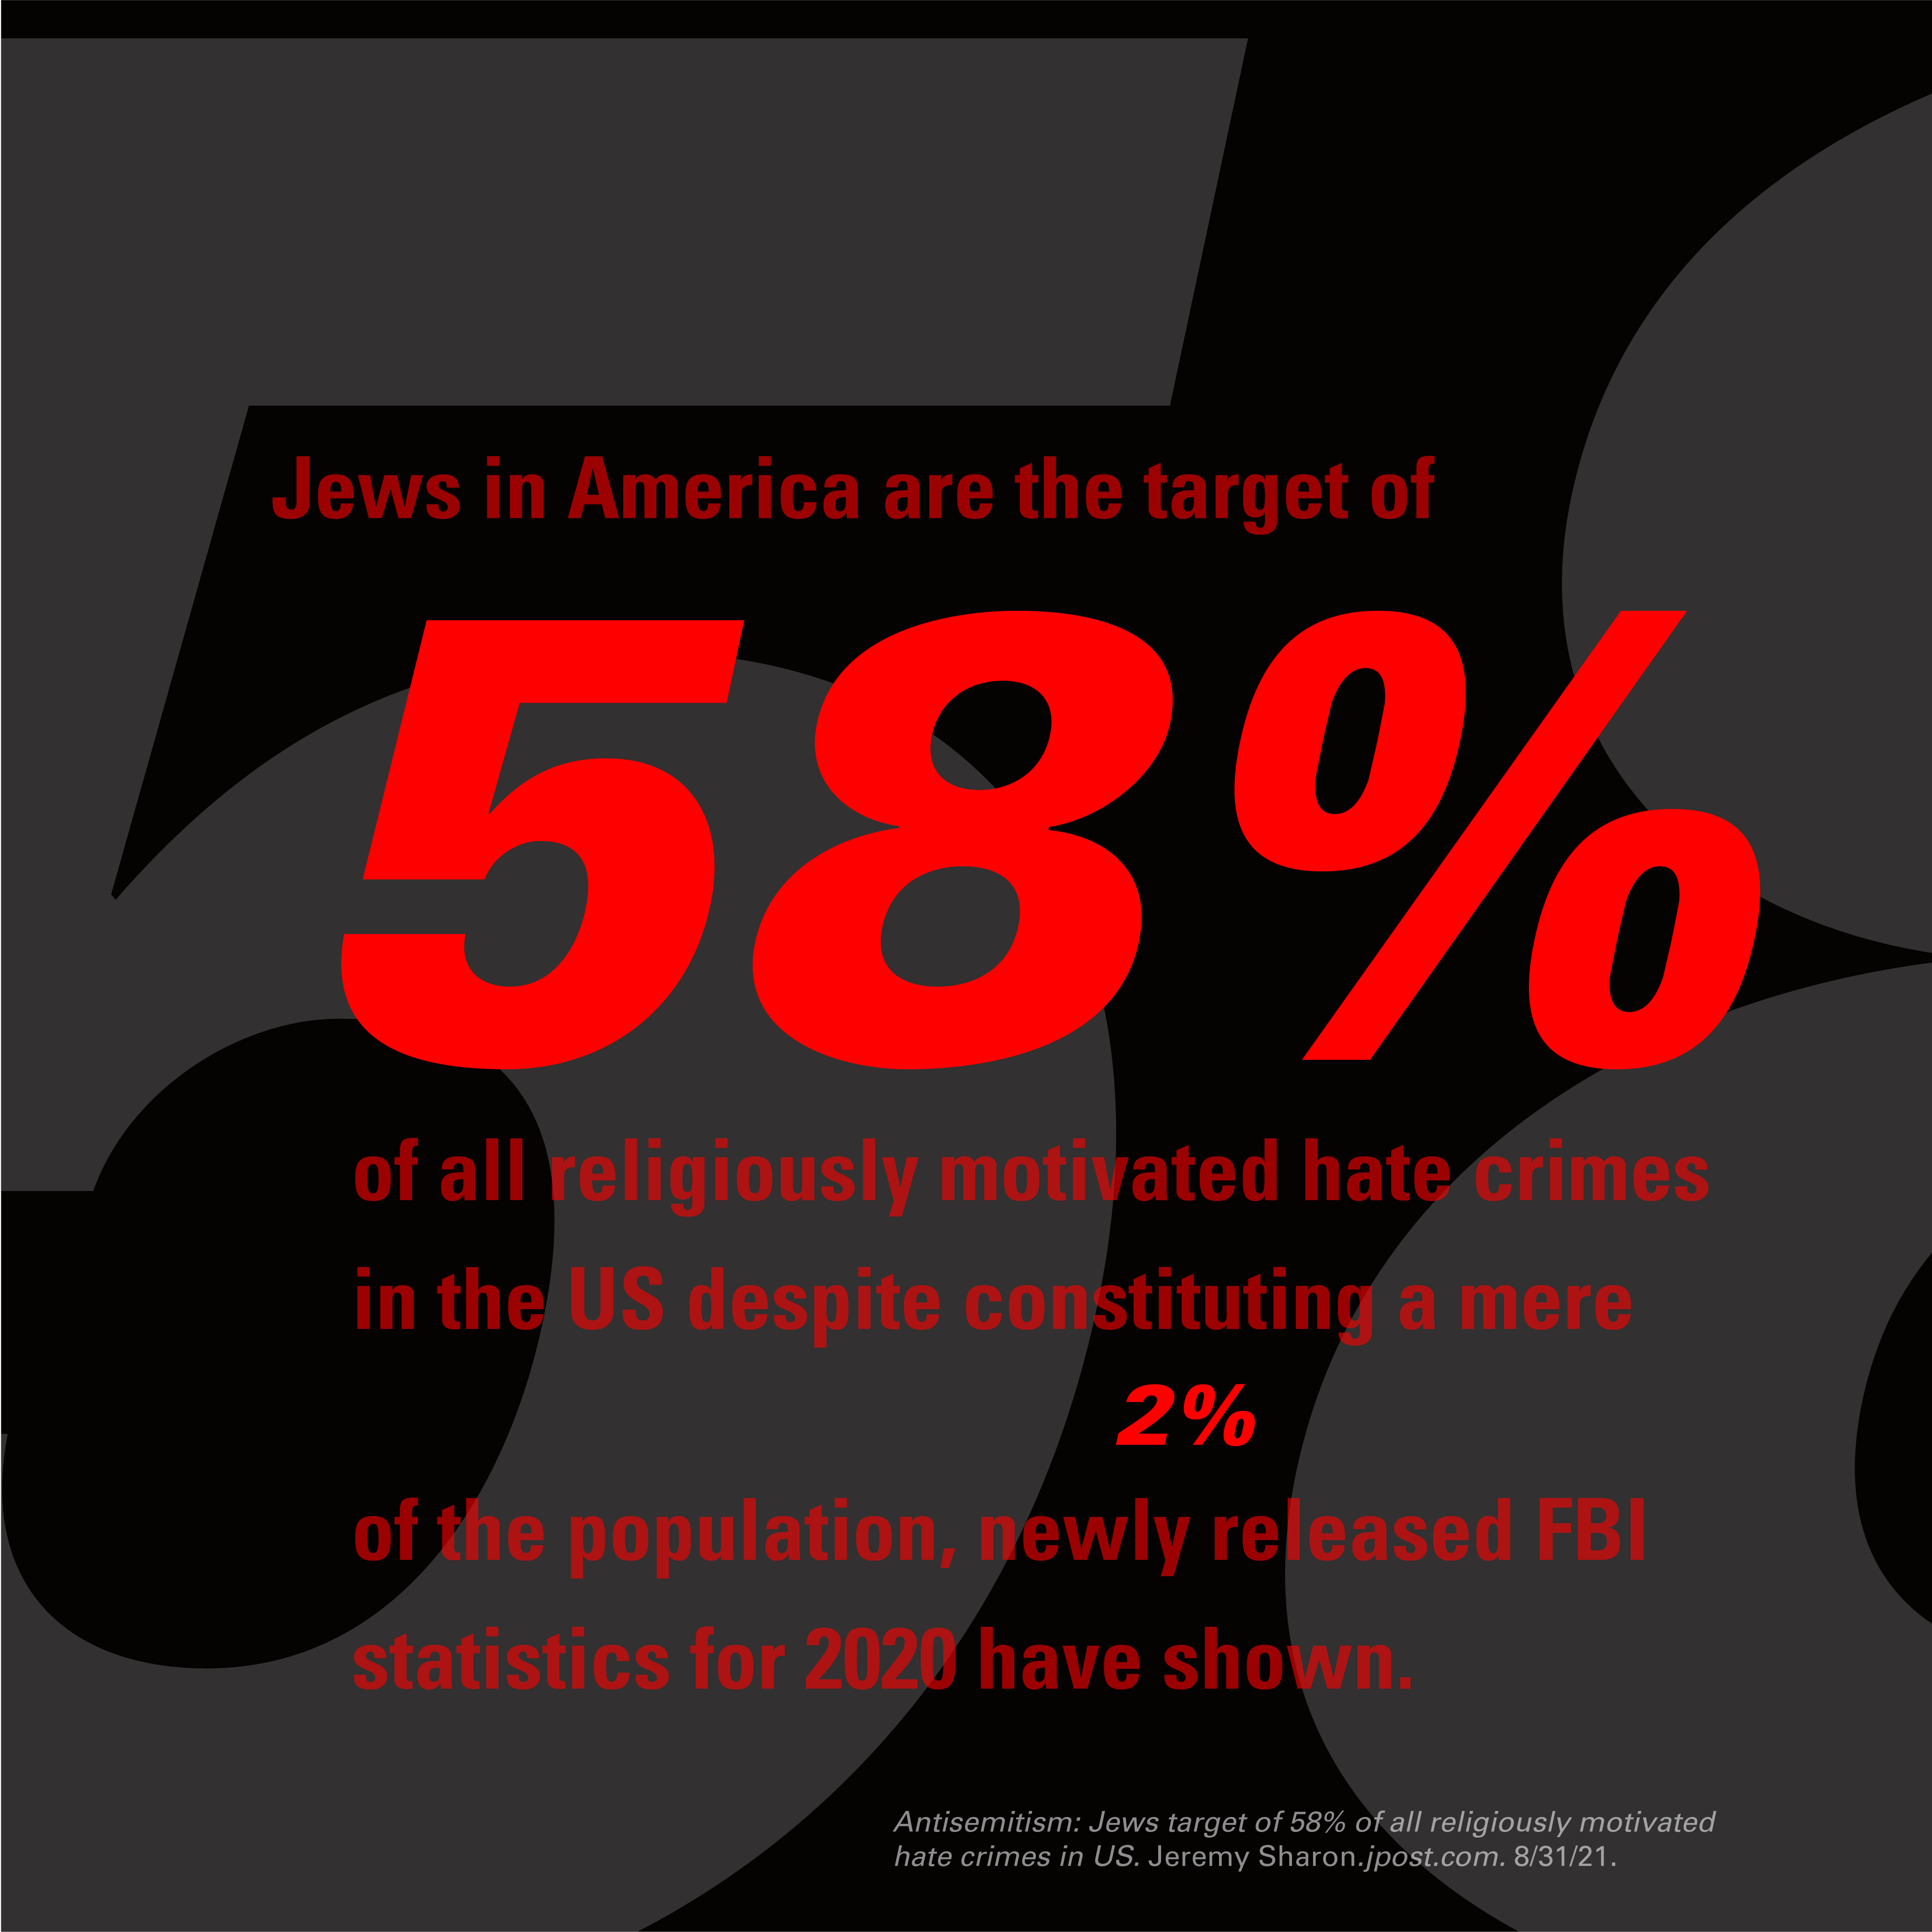
58 Percent
Graphic created after reading jpost.com article about the 2020 hate crime statistics.
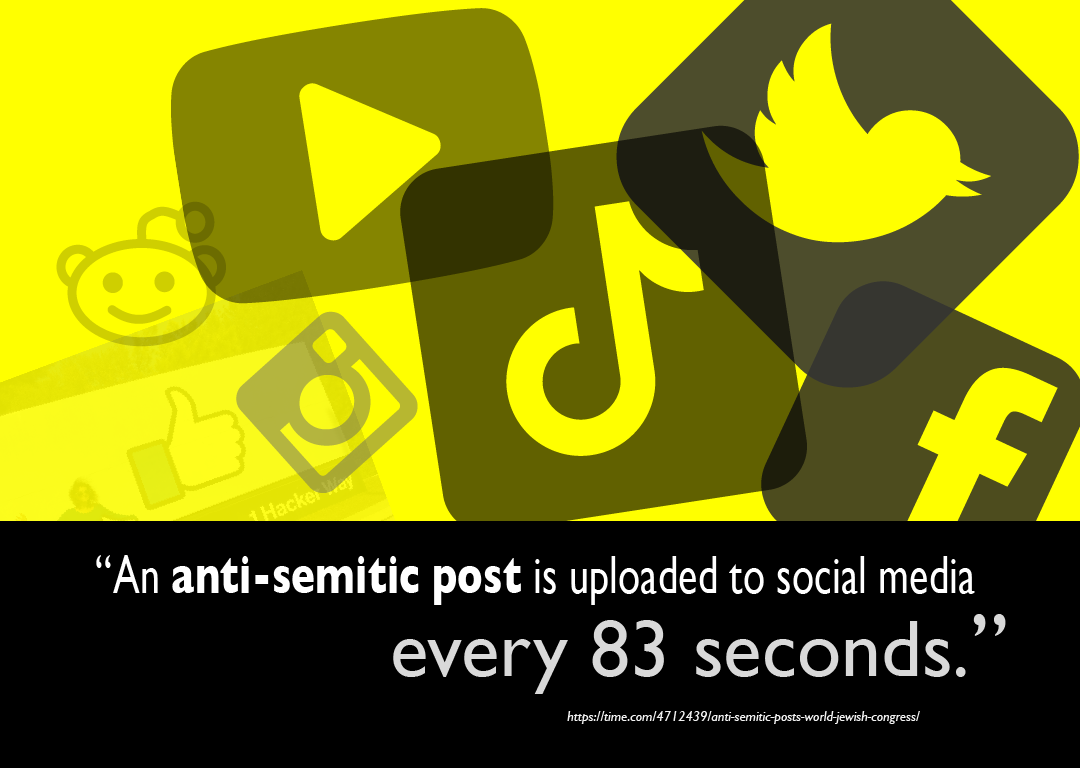
83 Seconds
Graphic created after reading There’s a New Anti-Semitic Message on Social Media Every 83 Seconds: Study. Melissa Chan. Time.com.
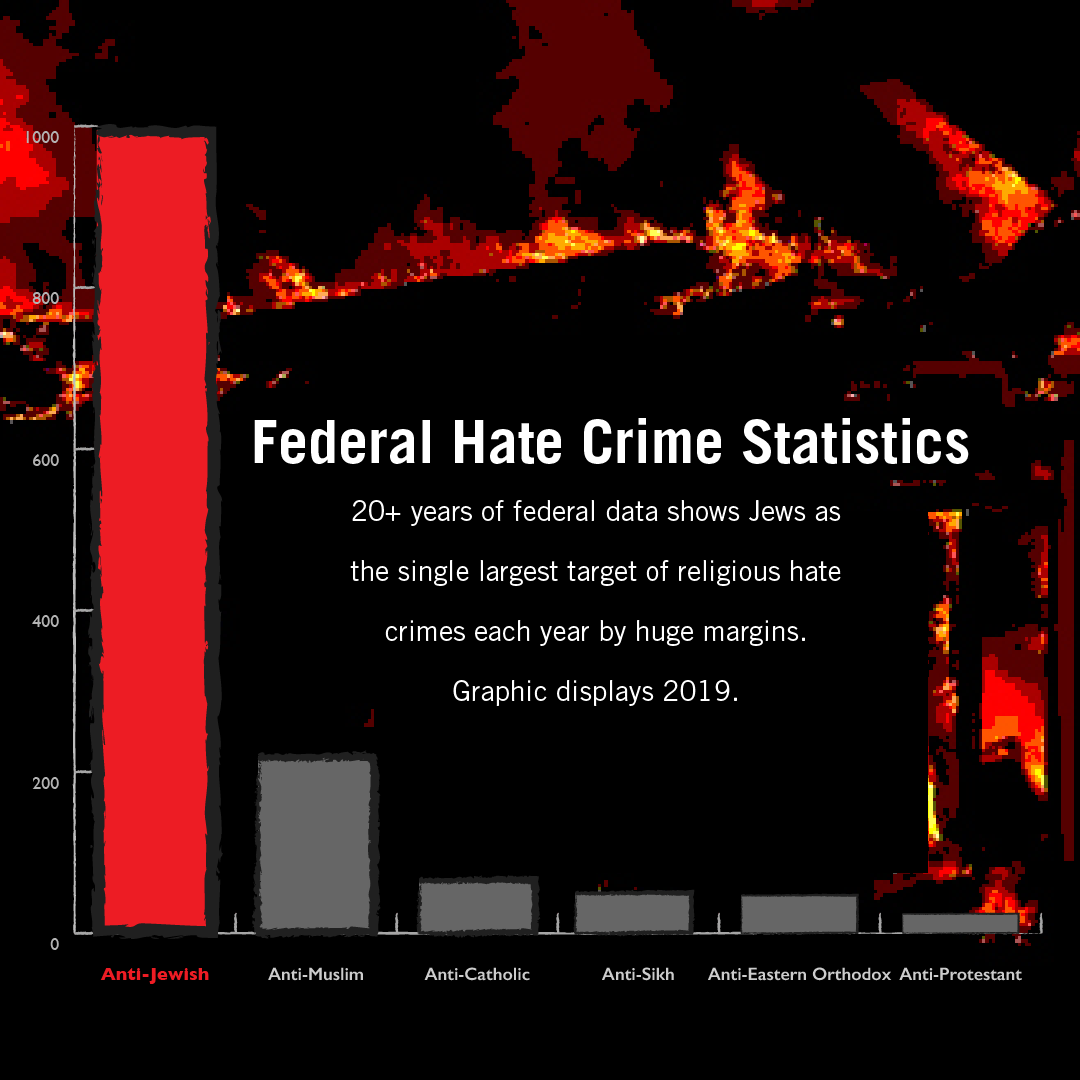
2019
Chart designed in response to the Federal Hate Crime Statistics, 2019. ucr.fbi.gov.
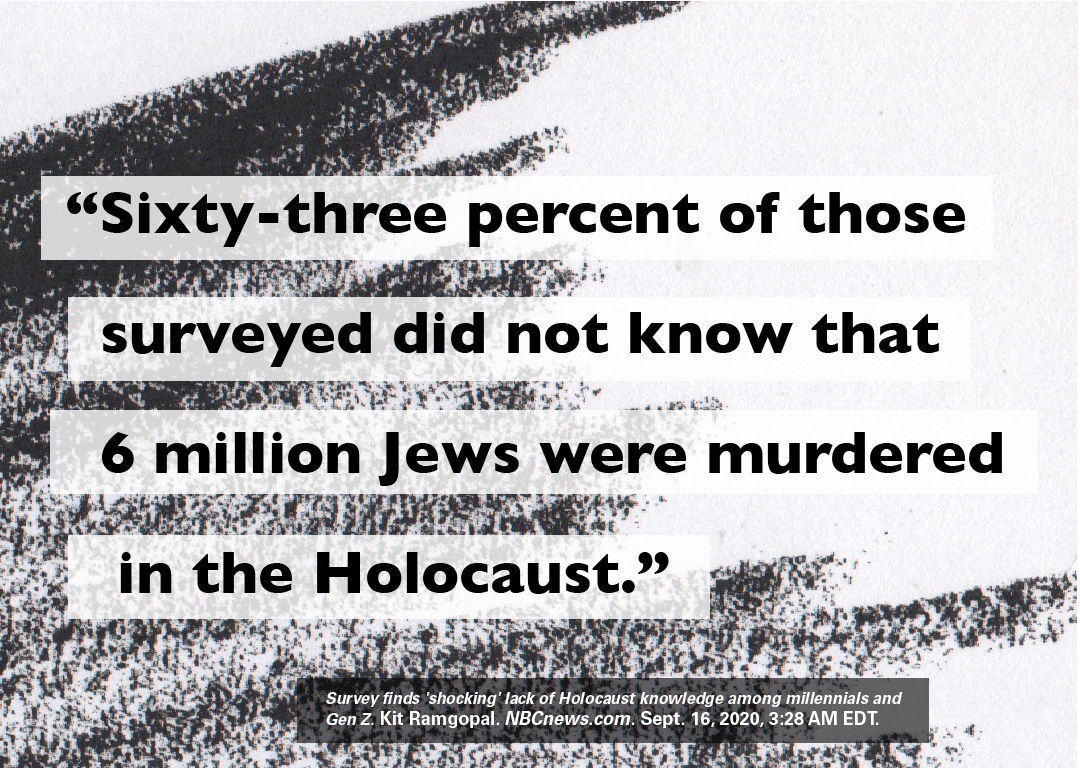
63 Percent
Graphic created after reading the results of the 2020 survey of 11,000 people age 18-39 in 50 states. The survey done by the Claims Conference.
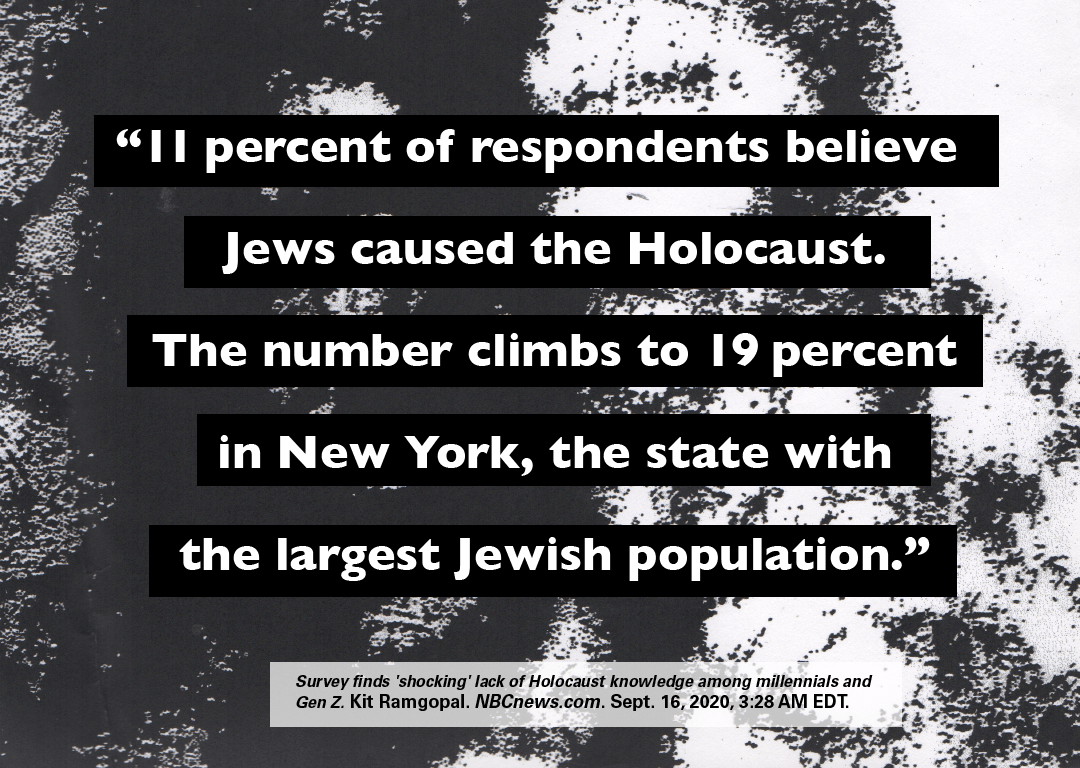
19 Percent
Graphic created after reading the results of the 2020 survey of 11,000 people age 18-39 in 50 states. The survey done by the Claims Conference.

Doubled
Graphic inspired by article, Hate Crimes Against Jewish Students are at An All Time High on Forbes.com.
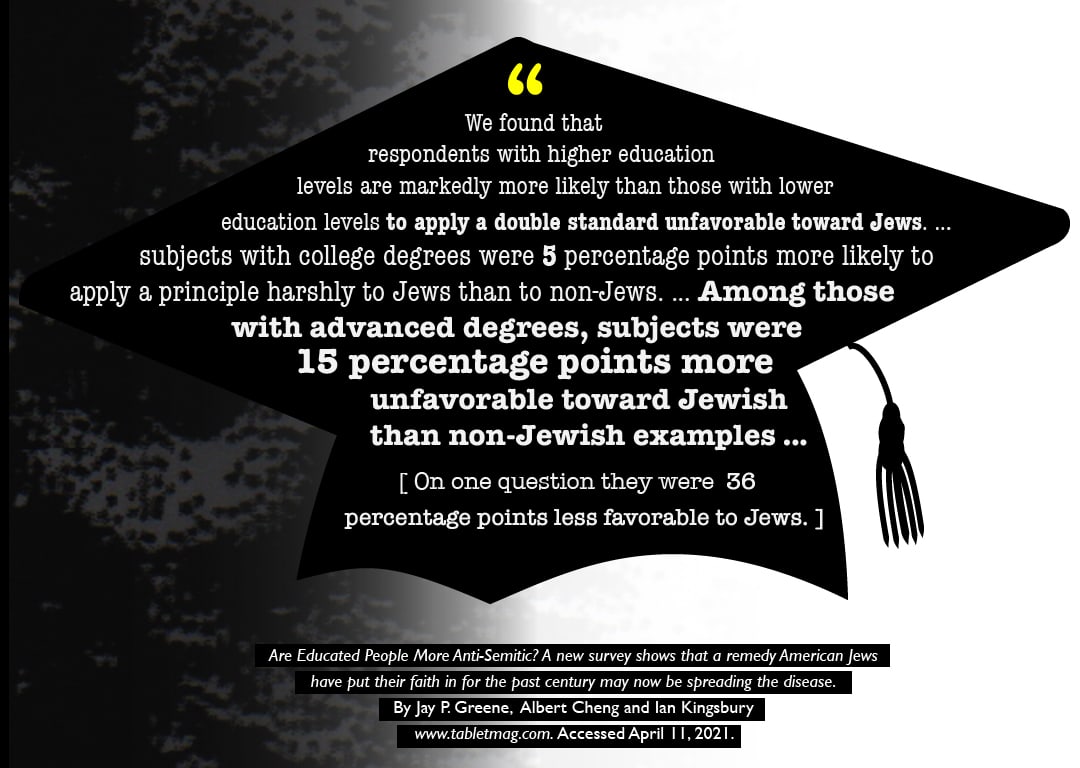
15 Percentage Points
I work in academia, so glad they did this research to quantify the issue: check out: Are Educated People More Anti-Semitic?
